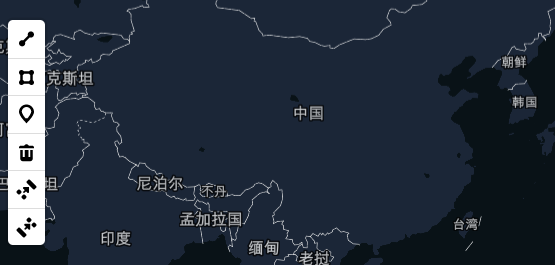
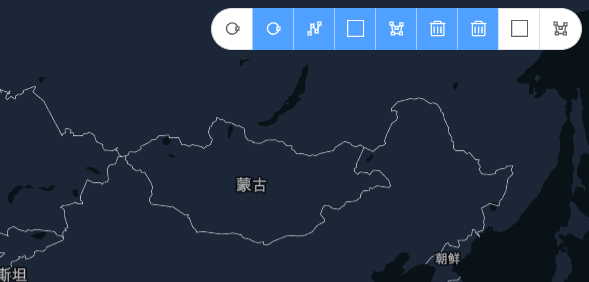
# 绘制&交互
绘制视图的属性请看API.
# 绘制视图

<template>
  <mapgis-web-map :accessToken="accessToken" :mapStyle.sync="mapStyle">
    <mapgis-draw
      class="custom-draw-wrapper"
      position="bottom-left"
      @added="handleAdded"
      @drawCreate="handleCreate"
    >
    </mapgis-draw>
  </mapgis-web-map>
</template>
<script>
export default {
  data() {
    return {
      accessToken: "some_token",
      mapStyle: "style_object"
    };
  }
};
</script>
# 交互视图
TIP
交互视图实际上封装绘制视图的行为,按照不同的业务进行对应的处理 如拉框选择,实际上是调用绘制矩形框的绘制功能,把绘制好的矩形删除即实现了拉框选取。 详细请看下面的自定义控件
handleCreate(e) {
  if (this.mode == "QueryByRect" || this.mode == "QueryByPolygon") {
    this.drawer.delete(e.features[0].id);
    // 执行查询操作
  }
},
toggleQueryByRect(e) {
  this.drawer && this.drawer.changeMode("draw_rectangle");
  this.mode = "QueryByRect";
},
toggleQueryByPolygon(e) {
  this.drawer && this.drawer.changeMode("draw_polygon");
  this.mode = "QueryByPolygon";
}
# 自定义控件
WARNING
几乎可以肯定的是,官方的绘制控件往往和实际需求不一致,因此需要实现一个自己的样式的空间,实现自己的用户鼠标交互

TIP
实现自定义绘制组件的核心是 <mapgis-draw> 内部的插槽,这里提供了支持任意 UI 的插槽方式。
关键代码如下 3 处:
<mapgis-draw>组件监听 @added="handleAdded" 获取整个绘制组件的对象<mapgis-draw>组件监听 @drawCreate="handleCreate" 获取整个绘制图元的对象- 自定义 UI 的 @click="toggleSimple" 触发绘制组建的方法
handleAdded(e, data) {
  let { drawer, map } = e;
  this.drawer = drawer;
},
handleCreate(e) {
  if (this.mode == "QueryByRect" || this.mode == "QueryByPolygon") {
    this.drawer.delete(e.features[0].id);
    // 执行查询操作
  }
},
toggleSimple(e) {
  this.drawer && this.drawer.changeMode("simple_select");
}
<template>
  <mapgis-draw
    class="custom-draw-wrapper"
    position="bottom-left"
    :controls="controls"
    @added="handleAdded"
    @drawCreate="handleCreate"
    ref="drawref"
  >
    <!--  <mapgis-draw-item v-for="item in buttons"> -->
    <mapgis-ui-button-group>
      <mapgis-ui-tooltip
        v-for="item in buttons"
        class="item"
        effect="dark"
        :content="item.tip"
        placement="bottom"
      >
        <mapgis-ui-button
          circle
          size="small"
          :type="item.type"
          @click="item.click"
        >
          <icon-font :type="item.icon" />
        </mapgis-ui-button>
      </mapgis-ui-tooltip>
    </mapgis-ui-button-group>
    <!--     </mapgis-draw-item> -->
  </mapgis-draw>
</template>

<style lang="scss">
.custom-draw-wrapper {
  position: absolute;
  top: 10px;
  right: 10px;
  z-index: 1000;
}
</style>

<script>
import IconFont from "@/components/IconFont/Icon";

export default {
  name: "CustomDraw",
  components: { IconFont },
  data() {
    return {
      buttons: [
        {
          icon: "iconvectorcirclevariant",
          type: "default",
          tip: "点选几何,按住shift可以框选",
          click: this.toggleSimple
        },
        /*  {
          icon: "iconbox",
          type: "default",
          tip: "框选几何",
          click: this.toggleDirect
        }, */
        {
          icon: "iconvectorcirclevariant",
          type: "primary",
          tip: "画点",
          click: this.togglePoint.bind(this)
        },
        {
          icon: "iconvectorpolyline",
          type: "primary",
          tip: "画线",
          click: this.togglePolyline
        },
        {
          icon: "iconbox",
          type: "primary",
          tip: "画矩形",
          click: this.toggleRect
        },
        {
          icon: "iconvector-polygon",
          type: "primary",
          tip: "画多边形",
          click: this.togglePolygon
        },
        {
          icon: "iconbox",
          type: "primary",
          tip: "画圆",
          click: this.toggleCircle
        },
        {
          icon: "iconvector-polygon",
          type: "primary",
          tip: "画半径",
          click: this.toggleRadius
        },
        {
          icon: "icontrash",
          type: "primary",
          tip: "删除选中图元",
          click: this.toggleDelete
        },
        {
          icon: "icontrash",
          type: "primary",
          tip: "删除全部",
          click: this.toggleDeleteAll
        },
        {
          icon: "iconbox",
          type: "default",
          tip: "矩形查询",
          click: this.toggleQueryByRect
        },
        {
          icon: "iconvector-polygon",
          type: "default",
          tip: "多边形查询",
          click: this.toggleQueryByPolygon
        }
      ],
      controls: {
        point: false,
        line_string: false,
        polygon: false,
        trash: false,
        combine_features: false,
        uncombine_features: false
      },
      mode: undefined
    };
  },
  methods: {
    enableDrawer() {
      const component = this.$refs.drawref;
      if (component) {
        component.enableDrawer();
      }
    },
    handleAdded(e, data) {
      let { drawer, map } = e;
      this.drawer = drawer;
    },
    handleCreate(e) {
      if (this.mode == "QueryByRect" || this.mode == "QueryByPolygon") {
        this.drawer.delete(e.features[0].id);
        // 执行查询操作
      }
    },
    toggleSimple(e) {
      this.enableDrawer();
      this.drawer && this.drawer.changeMode("simple_select");
    },
    toggleDirect(e) {
      this.drawer &&
        this.drawer.changeMode("direct_select", {
          featureId: "" // The id of the feature that will be directly selected (required)
        });
    },
    togglePoint(e) {
      this.enableDrawer();
      this.drawer && this.drawer.changeMode("draw_point");
    },
    togglePolyline() {
      this.enableDrawer();
      this.drawer && this.drawer.changeMode("draw_line_string");
    },
    toggleRect() {
      this.enableDrawer();
      this.drawer && this.drawer.changeMode("draw_rectangle");
    },
    togglePolygon() {
      this.enableDrawer();
      this.drawer && this.drawer.changeMode("draw_polygon");
    },
    toggleCircle() {
      this.enableDrawer();
      this.drawer && this.drawer.changeMode("draw_circle");
    },
    toggleRadius() {
      this.enableDrawer();
      this.drawer && this.drawer.changeMode("draw_radius");
    },
    toggleCombine() {},
    toggleUncombine() {},
    toggleDelete() {
      this.enableDrawer();
      this.drawer && this.drawer.trash();
    },
    toggleDeleteAll() {
      this.enableDrawer();
      this.drawer && this.drawer.deleteAll();
    },
    toggleQueryByRect(e) {
      this.enableDrawer();
      this.drawer && this.drawer.changeMode("draw_rectangle");
      this.mode = "QueryByRect";
    },
    toggleQueryByPolygon(e) {
      this.enableDrawer();
      this.drawer && this.drawer.changeMode("draw_polygon");
      this.mode = "QueryByPolygon";
    }
  }
};
</script>
# Draw & Measure 混用
TIP
混用的时候最常见的就是同时使用的删除问题,由于本质上绘制与测量组件使用的时同一个组件,因此无法同时激活或者删除。一般同时使用 Draw&Measure 的时候时需要主动切换激活功能/删除功能
// 调下面一种方法都会删除全部的绘制/测量结果,因此同时使用不需要重复删除
// 删除绘制结果
toggleDeleteAll() {
  this.enableDrawer();
  this.drawer && this.drawer.deleteAll();
},
// 删除测量结果
toggleMeasureDelete() {
  this.coordinates = [];
  this.enableMeasure();
  this.measure && this.measure.deleteAll();
}
<template>
  <mapgis-web-map
    class="mapgis-2d-map"
    @load="handleMapLoad"
    :mapStyle="style"
    :crs="crs"
    :center="center"
    :zoom="zoom"
  >
    <mapgis-draw
      position="top-left"
      :controls="controls"
      ref="draw"
      @added="handleDrawAdded"
    >
      <mapgis-ui-button-group class="mapgis-2d-draw-wrapper">
        <mapgis-ui-tooltip
          v-for="(item, i) in draws"
          :key="i"
          placement="bottom"
        >
          <template slot="title">
            <span>{{ item.tip }}</span>
          </template>
          <mapgis-ui-button
            circle
            size="small"
            :type="item.type"
            @click="item.click"
          >
            <mapgis-ui-iconfont :type="item.icon" />
          </mapgis-ui-button>
        </mapgis-ui-tooltip>
      </mapgis-ui-button-group>
    </mapgis-draw>

    <mapgis-measure
      position="top-left"
      :controls="controls"
      :measureMode="measureMode"
      ref="measure"
      @measurecreate="handleMeasureCreate"
      @measureresult="handleMeasureResult"
      @added="handleMeasureAdded"
    >
      <mapgis-ui-button-group class="mapgis-2d-measure-wrapper">
        <mapgis-ui-tooltip
          v-for="(item, i) in measures"
          :key="i"
          placement="bottom"
        >
          <template slot="title">
            <span>{{ item.tip }}</span>
          </template>
          <mapgis-ui-button
            circle
            size="small"
            :type="item.type"
            @click="item.click"
          >
            <mapgis-ui-iconfont :type="item.icon" />
          </mapgis-ui-button>
        </mapgis-ui-tooltip>
      </mapgis-ui-button-group>
      <mapgis-marker
        color="#ff0000"
        :coordinates="coordinates"
        v-if="coordinates.length > 0"
      >
        <div slot="marker" class="label">
          <div>面积:{{ area }}</div>
          <div>周长:{{ perimeter }}</div>
        </div>
      </mapgis-marker>
    </mapgis-measure>
  </mapgis-web-map>
</template>
<script>
export default {
  name: "App",
  data() {
    return {
      style: {
        version: 8,
        sources: {},
        layers: [
          {
            id: "背景",
            type: "background",
            paint: {
              "background-color": "rgba(0, 0, 0, 1)"
            }
          }
        ],
        sprite: "http://localhost:6163/igs/rest/mrms/vtiles/sprite",
        glyphs:
          "http://localhost:6163/igs/rest/mrms/vtiles/fonts/{fontstack}/{range}.pbf"
      },

      center: [113.10746, 23.01448], // [107.19, 26.85] [113.10746, 23.01448],
      zoom: 14, // 8  14,
      crs: "EPSG:3857",

      controls: {
        point: false,
        line_string: false,
        polygon: false,
        trash: false,
        combine_features: false,
        uncombine_features: false
      },

      drawer: undefined,
      draws: [
        {
          icon: "mapgis-erweidian",
          type: "default",
          tip: "点选几何,按住shift可以框选",
          click: this.toggleSimple
        },
        {
          icon: "mapgis-erweidian",
          type: "primary",
          tip: "画点",
          click: this.togglePoint
        },
        {
          icon: "mapgis-erweixian",
          type: "primary",
          tip: "画线",
          click: this.togglePolyline
        },
        {
          icon: "mapgis-erweiqu",
          type: "primary",
          tip: "画矩形",
          click: this.toggleRect
        },
        {
          icon: "mapgis-erweiqu",
          type: "primary",
          tip: "画多边形",
          click: this.togglePolygon
        },
        {
          icon: "mapgis-yuan1",
          type: "primary",
          tip: "画圆",
          click: this.toggleCircle
        },
        {
          icon: "mapgis-yuanxinbanjingyuan1",
          type: "primary",
          tip: "画半径",
          click: this.toggleRadius
        },
        {
          icon: "mapgis-shanchudangqianziceng",
          type: "primary",
          tip: "删除选中图元",
          click: this.toggleDelete
        },
        {
          icon: "mapgis-shanchudangqianziceng",
          type: "primary",
          tip: "删除全部",
          click: this.toggleDeleteAll
        },
        {
          icon: "mapgis-juxing1",
          type: "default",
          tip: "矩形查询",
          click: this.toggleQueryByRect
        },
        {
          icon: "mapgis-pinghangsibianxing1",
          type: "default",
          tip: "多边形查询",
          click: this.toggleQueryByPolygon
        }
      ],

      measureMode: "",
      coordinates: [],
      area: 0,
      perimeter: 0,
      measure: undefined,
      measures: [
        {
          icon: "mapgis-erweixian",
          type: "default",
          tip: "长度测量",
          click: this.toggleMeasureLength
        },
        {
          icon: "mapgis-erweiqu",
          type: "primary",
          tip: "面积测量",
          click: this.toggleMeasureArea
        },
        {
          icon: "mapgis-shanchudangqianziceng",
          type: "primary",
          tip: "删除测量",
          click: this.toggleMeasureDelete
        }
      ]
    };
  },
  methods: {
    handleMapLoad(payload) {
      this.map = payload.map;
    },
    enableDrawer() {
      const component = this.$refs.draw;
      if (component) {
        component.enableDrawer();
      }
    },
    handleDrawAdded(e) {
      let { drawer } = e;
      this.drawer = drawer;
    },
    toggleSimple() {
      this.enableDrawer();
      this.drawer && this.drawer.changeMode("simple_select");
    },
    togglePoint() {
      this.enableDrawer();
      this.drawer && this.drawer.changeMode("draw_point");
    },
    togglePolyline() {
      this.enableDrawer();
      this.drawer && this.drawer.changeMode("draw_line_string");
    },
    togglePolygon() {
      this.enableDrawer();
      this.drawer && this.drawer.changeMode("draw_polygon");
    },
    toggleRect() {
      this.enableDrawer();
      this.drawer && this.drawer.changeMode("draw_rectangle");
    },
    toggleCircle() {
      this.enableDrawer();
      this.drawer && this.drawer.changeMode("draw_circle");
    },
    toggleRadius() {
      this.enableDrawer();
      this.drawer && this.drawer.changeMode("draw_radius");
    },
    toggleDelete() {
      this.enableDrawer();
      this.drawer && this.drawer.deleteAll();
    },
    toggleDeleteAll() {
      this.enableDrawer();
      this.drawer && this.drawer.deleteAll();
    },
    toggleQueryByRect() {},
    toggleQueryByPolygon() {},
    handleMeasureAdded(e) {
      let { measure } = e;
      this.measure = measure;
    },
    getMeasureResult(result) {
      console.log(result);
      let formateResult;
      let marker;
      switch (this.measureMode) {
        case measureModes.measureLength:
          formateResult = (result.result / 1000).toFixed(2);
          marker = {
            coordinates: result.coordinates[result.coordinates.length - 1],
            text: formateResult + "千米",
            style: "color:red"
          };
          this.measureMarkers.push(marker);
          break;
        case measureModes.measureArea:
          formateResult = (result.result / 1000000).toFixed(2);
          marker = {
            coordinates: this.getCenterOfGravityPoint(result.coordinates[0]),
            text: formateResult + "平方千米",
            style: "color:red"
          };
          this.measureMarkers.push(marker);
          break;
      }
    },
    enableMeasure() {
      const component = this.$refs.measure;
      if (component) {
        component.enableMeasure();
      }
    },
    handleMeasureCreate(e) {
      // this.measure && this.measure.deleteAll();
      console.log("绘制结果", e);
      this.disableDrag();
    },
    handleMeasureResult(e) {
      console.log("测量结果", e);
      this.disableDrag();
      const coords = e.center.geometry.coordinates;
      this.coordinates = coords;
      this.area = e.geographyArea || "无";
      this.perimeter = e.geographyPerimeter;
    },
    disableDrag() {
      const vm = this;
      vm.map.on("draw.selectionchange", e => {
        const { features, points } = e;
        const hasLine = features && features.length > 0;
        const hasPoints = points && points.length > 0;
        if (hasLine && !hasPoints) {
          // line clicked
          if (vm.measure.getMode() !== "direct_select") {
            vm.measure.changeMode("simple_select", { featureIds: [] });
            // vm.measure.changeMode('direct_select', { featureId: features[0].id });
          }
        } else if (hasLine && hasPoints) {
          // line vertex clicked
        } else if (!hasLine && !hasPoints) {
          // deselected
        }
      });
    },
    toggleMeasureLength() {
      this.enableMeasure();
      this.coordinates = [];
      this.measureMode = "measure-length";
      this.measure && this.measure.changeMode("draw_line_string");
    },
    toggleMeasureArea() {
      this.enableMeasure();
      this.coordinates = [];
      this.measureMode = "measure-area";
      this.measure && this.measure.changeMode("draw_polygon");
    },
    toggleMeasureDelete() {
      this.coordinates = [];
      this.enableMeasure();
      this.measure && this.measure.deleteAll();
    }
  }
};
</script>
# 自带控件

TIP
通过属性 enableControl 可以控制是否使用自带控件,其提供了点、线、矩形、多边形以及圆的绘制功能
<template>
  <mapgis-web-map :accessToken="accessToken">
    <mapgis-igs-tdt-layer
      :token="token"
      :baseURL="baseURL"
      :crs="crs"
      :layerId="layerId"
      :sourceId="sourceId"
    >
    </mapgis-igs-tdt-layer>
    <mapgis-draw
      position="top-left"
      @added="handleAdded"
      @drawCreate="handleCreate"
      @update-radius="handleRadiusUpdate"
      :editable="false"
      :enableControl="true"
      ref="drawref"
    >
    </mapgis-draw>
  </mapgis-web-map>
</template>

<script>
export default {
  name: "CustomDraw",
  props: {},
  data() {
    return {
      accessToken:
        "pk.eyJ1IjoibHZ4aW5nZGV0dXppIiwiYSI6ImNrcmJkb3dwMDIycnkycXIyYW96ejQ5czcifQ.RftxemAeBo-0pa-FZqm5vw",
      token: "3af3270f5f558ed33dcf9aacfb7a01b5",
      baseURL: "http://t0.tianditu.gov.cn/img_w/wmts",
      crs: "EPSG:3857",
      layerId: "tdt",
      sourceId: "tdt"
    };
  },
  methods: {
    enableDrawer() {
      const component = this.$refs.drawref;
      if (component) {
        component.enableDrawer();
      }
    },
    handleAdded(e, data) {
      let { drawer, map } = e;
      this.drawer = drawer;
    },
    handleCreate(e) {
      const vm = this;
      if (this.mode == "QueryByRect" || this.mode == "QueryByPolygon") {
        this.drawer.delete(e.features[0].id);
        // 执行查询操作
      }
    },
    handleRadiusUpdate(e) {
      // this.drawer && this.drawer.changeMode("simple_select");
      console.log("e", e);
      console.log("center", e.center.geometry.coordinates);
    }
  }
};
</script>